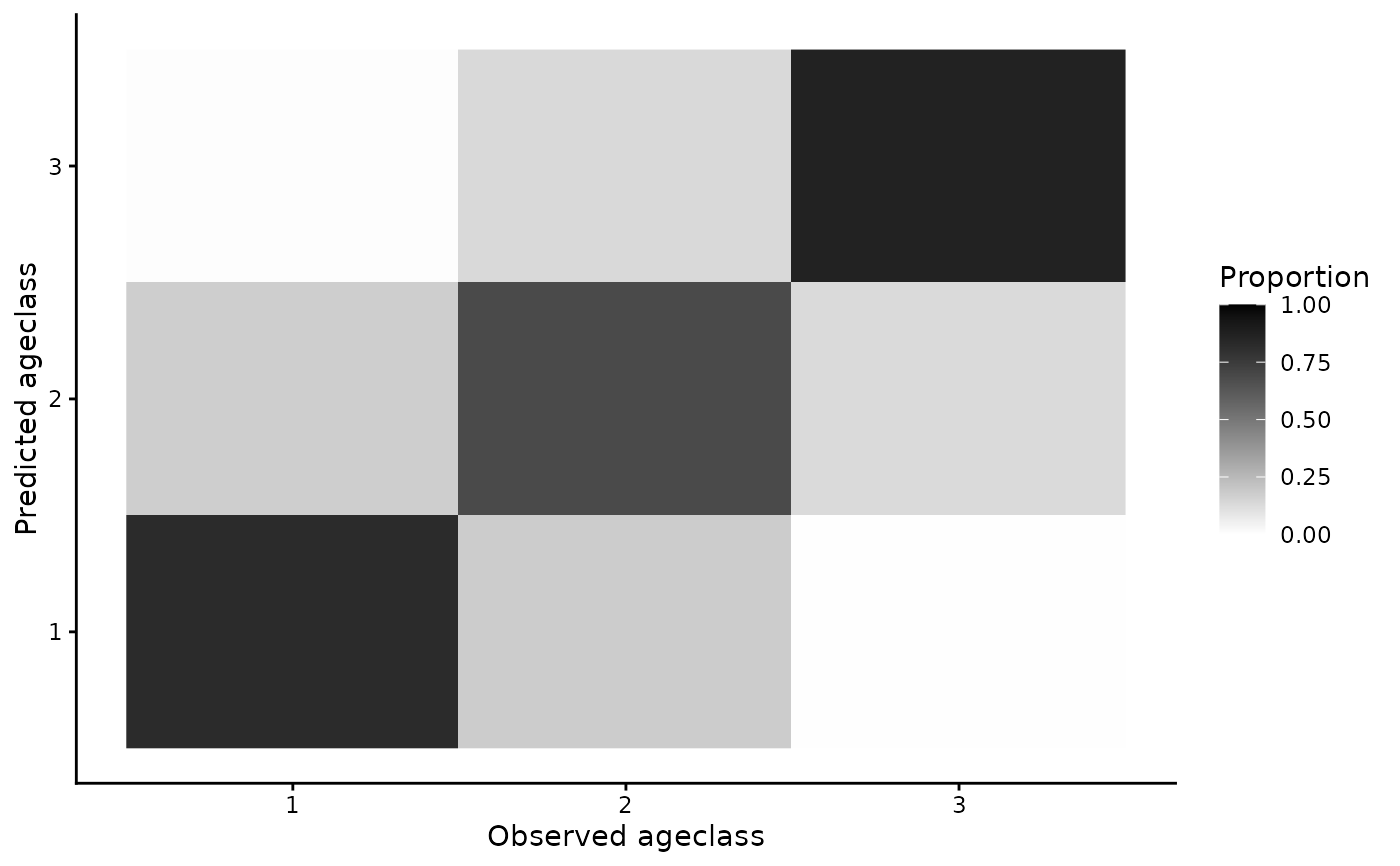
Plot confusion matrix for fit_ageclass objects of predicted age class versus
observed age class.
Usage
# S3 method for class 's4t_ageclass_model'
plot(x, ...)Examples
sim.dat <- sim_simple_s4t_ch(N = 2000)
m1 <- fit_ageclass(age_formula = ~ FL,
                   s4t_ch = sim.dat$s4t_ch)
plot(m1)